Code Blooded 2/3/22
Special Edition: Florence Nightingale


This is days late, and I am sorry. I unexpectedly had a birthday and instead of ignoring it like every year, I did not so... yay!
Now back to your regularly scheduled programming.
This newsletter seeks to look at the fun and exciting world of data journalism. The history you did not realize you needed, and the updates you did. But naturally it also has to sometimes hit on the obvious, because ignoring history is bad. So this week I present a true bada** in data journalism, the Lady with the Lamp— Florence Nightingale.
While we think of things like pie charts as simple form of graphing but these idea was revolutionary when it was first used. Florence was a pivotal person for these charts,
Florence accessibility to literature and education did not come from just anything. She was a British socialite in her own right—her mother’s father sat in the English House of Commons for nearly half a century and her father was a prominent abolitionist. Born and raised in Tuscany, she was exposed to a plethora of knowledge, far more than the average woman in the Victorian era. But she chose a different route from her family, pushing past gender norms and becoming a well rounded icon in a different light. Her career focused in far more than the medical field— revolutionizing data visualization.
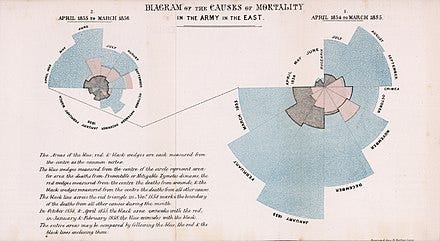
Florence’s work was focused in statistical graphics, looking at the wrongdoings she saw during her time as a nurse. One report she created analyzed the British army while in India during and how things like overcrowding and water contaminations were causing soldiers to die at at a higher rate than they were in combat.
This was one of the reports (The Royal Commission on India) that modernized the idea of a polar area diagram, also called the Nightingale rose diagram, something barely used until she did. This graphic style is also known as a pie chart, but back then the British still loved their Alfredian terminologies. The report includes drawings from her somewhat distant cousin whom she lived with, Hilary Bonham Carter.
Fun Fact: Hilary Bonham Carter is directly related to the actor who played Bellatrix Lestrange in the Harry Potter movies. The family is made up of socialites and barons dating back to before the US even even existed and Florence was vaguely one of them, as her mother married into the family. In ye ole’ England, she was not full blood Bonham Carter, but more of a mudblood (Harry Potter reference).
Her report told of the failures in sanitation and hygiene and lead to a change of medical care in the so called “India Situation”. After ten years of reform inspired by her statistical analysis, the mortality rate dropped from 69 to 18 per 1,000 soldiers. This was revolutionary, considering the bubonic plague (that terrifying thing that nearly wiped out all of Europe and Asia) was still lingering in her time.
But Florence did something for people besides the Brits who were trying to take something that was not there’s to have. She did a study of sanitization in rural India and attempted to apply her so called modern medicinal standards to them. She worked in an unbiased approached— she saw a problem, and attempted to fix it through data visualizations
Florence went to many places, and India is just an example.
She also collected data and kept detailed records so that future treatment could be streamlined. while this may seem like an obvious thing to do, this was ye ole’ times, and the obvious was not in fact obvious.
What made her powerful was not her wondrous colors or detailed information, but how she made an argument. Victorian era mathematicians commonly used tables or the numbers themselves to make a point, but she used a rather different approach. Her approach was to portray the problem for what it is, not what anything else wanted it to be.
News
What to look out for
No new news, but this story on solution journalism in Tanzania is neat.
Spotlight
Recent, cool data stuff
The Big Law Firms Defending Police In Misconduct Lawsuits
Law 360 (Not data, but a good read nevertheless. )
Why The Same Temperature Can Feel Different Somewhere Else
FiveThirtyEight
Thats all for this week!